“If you can meet with Triumph and Disaster and treat those two impostors just the same.” Rudyard Kipling, If
We all want to know who’s hot and who’s not, and in football our assessment of triumph is for the most part a binary process. In these days of blink-of-an-eye judgements, the measure of a man or a manager is made in what is little more than the sixty seconds of a single season. Success is winning things. Disaster is relegation. Indeed for some in the harshly interrogative light of the modern era, disaster is simply an inability to win a trophy.
Such judgements are so subjective as to be worthless. Yet still, the question of who has been a triumph or a disaster as a football manager is asked on a daily basis on Twitter and on radio talk shows. It is a question on which men’s livelihoods are at stake.
Yet no football competition is perfectly balanced. From the school fields where some children have the physical benefits of being faster developers than their peers, to the Premier League arms race and its financial winners and losers, football games cannot be even. For this reason I think it better to consider clubs and managers’ achievements in the context of the competitions in which they play.
That is all very well, but against what measure should we hold up a club or a manager’s performance over a season? One popular metric has been wages, by which teams can be ranked as surely as they can in a league table. Many analysts hold the cumulative wage bill of a squad to be a strong indicator of where a club will finish over the course of a season.
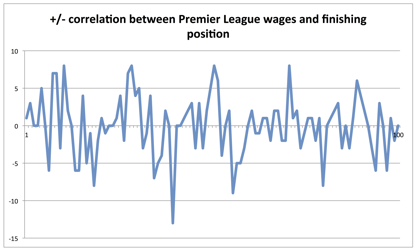
However, over the course of the five most recently completed Premier League seasons for which financial data are available, I have found there to be only 16% accuracy when treating wage bills as a predictor of league finishing position. That is to say that across the 100 Premier League places played for over the five years, on only 16 occasions did a club’s wage-bill ranking intersect with its final league standing. Even allowing for +/-1 place (being 5%), it really is very streaky, as the graph below shows, with only 35% accuracy within that margin for error.
The closer to the central axis the line in the graph is, the closer the correlation between wages and finishing position would be. As you can see, there have been some pretty violent spikes over the years, such as when Queen’s Park Rangers finished 13 places below where their wage ranking would have placed them in 2013. Or the six, seven and nine places below their wage investment Villa have found themselves in each of the past three years for which financial data are available.
However, there appears to be a somewhat closer correlation between estimated overall squad values and finishing position. Of course, by definition, no estimate can be 100% accurate but the publicly available values ascribed by the excellent Transfermarkt.com – a resource used by many club executives, by the way – are a good enough indicator of roughly what to expect from a team each season. It follows that those with the highest-value squads will compete for the title, and those with the lowest–value squads can expect to have to guard against relegation. This much was evidenced last season, as the table below demonstrates.
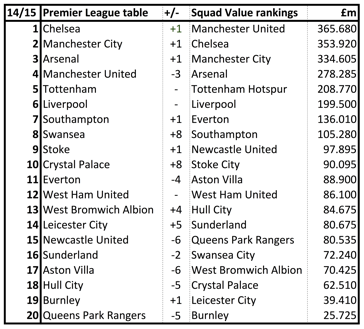
With a margin of error of +/-1, Transfermarkt.com’s estimates of squad-value rankings came in with a 45% degree of accuracy in correlation with the overall finishing table for 2014-15. This is good, but it is not quite right. A cumulative wage bill, even a cumulative squad value, will of course be a woolly measure for predicting a club’s overall performance. Every wage bill covers playing, managerial, coaching, backroom, directorial, executive and ancillary staff, not just the 25-man squad. Although the Transfermarkt squad value is more focused, that, too, covers 25 players and more, not only those 11 who really matter from week to week.
The table above therefore leads me to further inquiry. There are still some spikes in its analysis, such as Aston Villa again dropping six places below their asset value, or Crystal Palace and Swansea City achieving finishes eight places above theirs. So why did those teams that fared markedly better or worse than their rivals perform as they did? Was it down to the manager? Or was it something else?
Well, as in all things, it seems that in Premier League football Lady Luck really can play her part. It is in terms of injuries that Fate’s finger points. I have discovered there is a very strong link between how a club performs over the course of a season and the number of injuries they suffer to first-team starters.
My analysis of performance has therefore been refined according to the following methodology:
1. Definition of first-team starters: The composition of any club’s starting 11 will change over the course of a season according to form and fitness. Therefore I counted players who had been involved in the previous three or more consecutive starting 11s prior to their injury absence as having been first-choice players.
2. Definition of injury: For an injury absence to have an effect on a team’s performance, it has to be considered more severe than a knock that keeps a player out for a game or two. I therefore considered an absence of 60 days as a reasonable cut off for an impactful injury, one that chimes with the considerations of a lot of clubs.
With 11 players starting in 38 matches over the course of a season, there are 418 potential starting places. I added up the cumulative number of games first-choice starters missed in 60-day blocks or more and what I discovered was very interesting indeed. It turns out we can apply four bands of extended-injury frequency to a club’s experience, across which there was a fairly even distribution across the Premier League last season.
Clubs that suffer long-term unavailability of first-choice starters in less than 5% of their 418 starting positions have had a light injury experience. Those who have between 5% and 9.99% have an expected injury experience, between 10% and 14.99% it is heavy and above 15% severe.
Adding these inputs to the table above brings fascinating results.
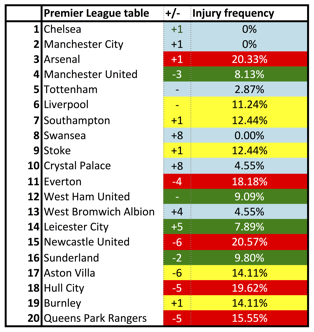
Those in the pale-blue band have got away with a light extended-injury frequency, the greens have suffered the expected case, those in yellow the heavy case and those in red severe.
It is surely no coincidence that all three relegated clubs were hit with injuries that were either very heavy or severe. In two of those cases the teams ended up five places below their expected finishing position according to squad-value estimates. At the top end of the table by contrast, the experience was ridiculously light – neither Chelsea nor Manchester City suffered a single injury keeping any first-team player out for 60 days or more.
Their success was compounded by the super-severe injury experience of Arsenal, who lost to major injury their core first-teamers for more than a fifth of the games they would otherwise have been available. (For the record, I did not count Abou Diaby or even the England international Alex Oxlade-Chamberlain, kept out for 24- and nine-game strings of games respectively, because the methodology considered neither to be a first-team starter at the time of their injuries.)
For Swansea City, Crystal Palace and West Bromwich Albion, who exceeded expectations by eight, eight and four Premier League positions respectively, injury experience was very light. Newcastle United, who had statistically the worst injury record in 2014-15, were left six places below their expected finishing position.
It leaves us with the following picture of just how much effect a freakishly good or bad run of injuries can have on a club’s season:
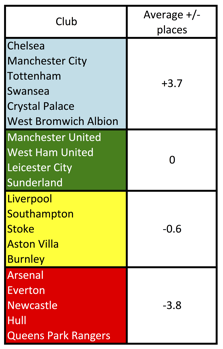
It is quite clear from the above that injuries really matter, and no one can ever tell when they will strike. After their blistering start to this campaign, Manchester City are considered a 1/2 chance to win the current Premier League title, meaning that for every £1 staked, 50p in winnings would be returned. But what if Sergio Agüero, Raheem Sterling, Wilfried Bony, Yaya Touré, Vincent Kompany and Joe Hart were to suffer the cumulative 85 matches of absence that Theo Walcott, Mesut Ozil, Olivier Giroud, Jack Wilshere, Mathieu Debuchy, David Ospina and other starters did at Arsenal last season? What if Chelsea or Manchester United were to? Would they even finish in the Champions League positions?
In this attention-deficient, short-term world of ours, reputations can be made or broken over the course of a single season. But there is too much at stake in the Premier League for snap judgements, particularly about the quality of the men in the dugout. Triumph and disaster are indeed impostors: after squad values, what matters most is luck with injuries – for players to have the legs to keep on running.
As Kipling wrote: “If you can fill the unforgiving minute With sixty seconds’ worth of distance run, Yours is the Earth and everything that’s in it, And – which is more – you’ll be a Man, my son.”
Related article: http://www.insideworldfootball.com/matt-scott/17531-matt-scott-jose-is-talking-piffle-but-can-he-do-without-the-presents-of-the-past
Journalist and broadcaster Matt Scott wrote the Digger column for The Guardian newspaper for five years and is now a columnist for Insideworldfootball. Contact him at [email protected].