By Paul Nicholson
January 17 – European football has never had it so good, it’s official, and the latest UEFA Club Licensing Benchmarking Report backs this up with an impressive gathering of statistics and analysis that reports another financial year (2016) of 10% growth for the European game.
The report is not without a warning, however, from both UEFA president Aleksander Ceferin and report author Sefton Perry, head of the UEFA Intelligence Centre Analytics. While the success story is a stand out for any business sector you want to compare it against, the bulk of that growth is being achieved at Europe’s biggest and most successful clubs and, to some extent leagues, via their enormous television deals.
The impression is that they and their earning capacity are driving the business, and UEFA is hanging on to their coattails to keep it regulated with some kind of fairness and ‘solidarity’ for its wider membership.
In his remarks on the report Ceferin notes: “It (the report) shows that UEFA’s regulatory role in financial fair play continues to steady the ship of European football finances and provide a basis for unprecedented growth, investment and profitability. It also demonstrates that while the game remains essentially the same on the pitch, it continues to change significantly off the pitch, making it essential that we at UEFA and our other stakeholders continue to remain vigilant and true to our values.”
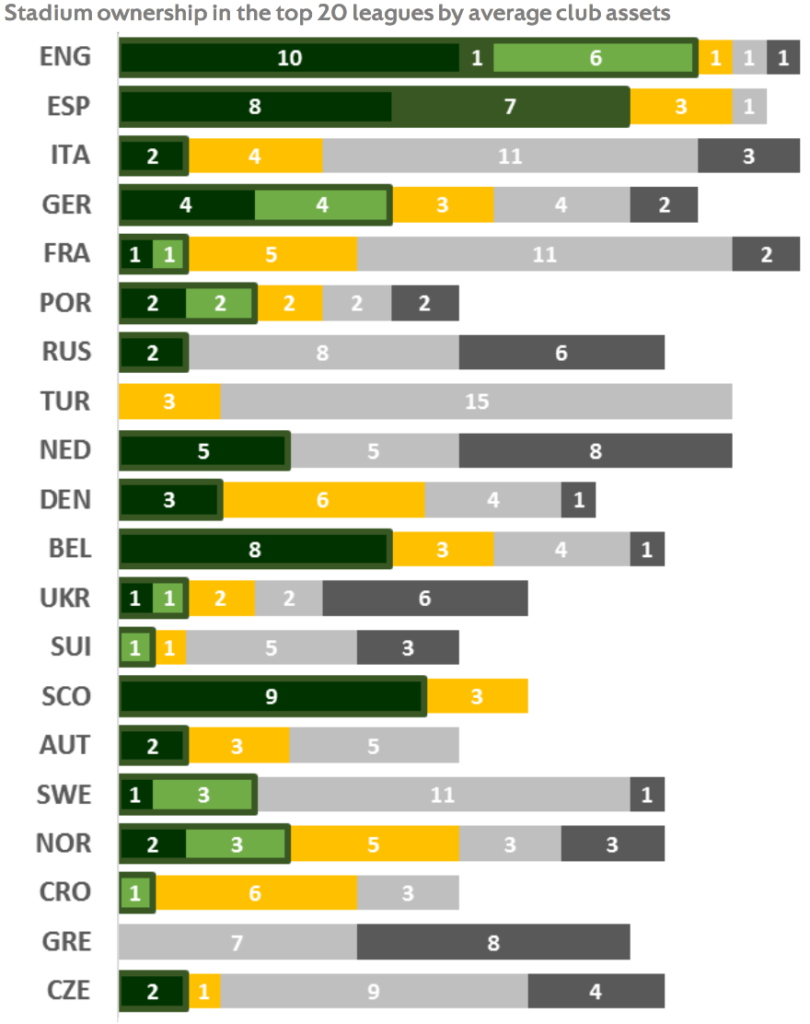
Ceferin highlights that Europe’s 700 top-division clubs “together generating the highest operating profits before transfers in history”, while 2016 saw for the first time more than €1 billion invested in stadiums and “long-term assets” (not players!). He also praises the on-going success of UEFA financial fair play and how it has spawned a culture within national associations to introduce their own versions.
But once again it is the gap between the ‘haves’ and the ‘have-nots’ (we should perhaps rename them as the ‘have-not-so-much’) that rings ‘gentle’ alarm bells. Ceferin says that gap (driven by commercial and sponsorship revenues) is accelerating and that UEFA needs to be careful that it doesn’t fall into it. “The top 12 ‘global’ clubs generated a dramatic increase in commercial and sponsorship revenues of €1.58bn in six years – more than double the increase of all other European top-division clubs combined. As the guardians of the game, UEFA must ensure that football remains competitive even as financial gaps are augmented by globalisation and technological change.”
Perry emphasises the same theme in his remarks saying: “The twin forces of technology and globalisation are leading to an unprecedented reshaping of the club football landscape. Only a limited number of clubs are able to fully exploit the enormous commercial opportunities offered by the global market. These clubs are opening offices across the world, introducing new categories and tiers to their commercial partnerships and using technology to offer tailored access to their supporters and expand the brand of both the clubs and their partners.”
The proof of this is in the 120+ pages of data covers the financial developments of 681 top-division clubs across more than 50 leagues. Interestingly UEFA has a huge amount of skin in the financial game with UEFA club competition prize money and solidarity payments having provided 50% of all revenue growth for clubs outside the top six leagues, while UEFA’s sponsorship and commercial revenues have contributed 55% of all new revenue since 2010 for Europe’s top dozen clubs.
The report looks attendance trends, domestic league structures and club finances as well as the new football metrics such as a comparison of clubs’ and players’ social media footprints, an analysis of football agent commission rates and agent concentration across leagues, the overlap between the 2017/18 league start and transfer window end, and the increase in cross-border and multi-club ownership.
Some of the highlighted stats in the report include:
- League attendances decreased in 2016/17 in 62% of leagues, reversing some of the 2015/16 attendance increases
- 22 European clubs’ websites now receive over a million monthly visitors, with the percentage of foreign visitors ranging from 91% (FC Barcelona) to 5% (Galatasaray SK)
- Club ownership in major leagues is relatively stable, with only 5% of clubs changing hands in the last 12 months
- More than 20 clubs in the top 15 major European leagues are linked to multi-club ownership structures
- The top three clubs generate more than 100 times the kit manufacturing revenue and 25 times the shirt sponsorship revenue of smaller clubs in their league
- A number of kit manufacturer deals cover ten or more years with only one in eight clubs switching in 2017
- Club kit manufacturers are surprisingly diverse, with 41 different brands and adidas and Nike’s combined market share just 40%
- Wage growth has increased to 8.6% but remains below the 9.5% club revenue growth
- For the first time on record, the average wage bill of English Premier League clubs was more than double that of the next highest-paying league (Bundesliga)
- The player share of total club wages averages 71%, ranging from 55% in Denmark to 84% in Spain and Turkey
- Transfer fee inflation yielded record club profits on player sales in 2016, driving a decrease in net transfer costs to just 1.1% of revenue
- 166 clubs in Europe reported net transfer proceeds equivalent to more than 10% of revenue in 2016, underlining the dependence of many clubs on transfer activity
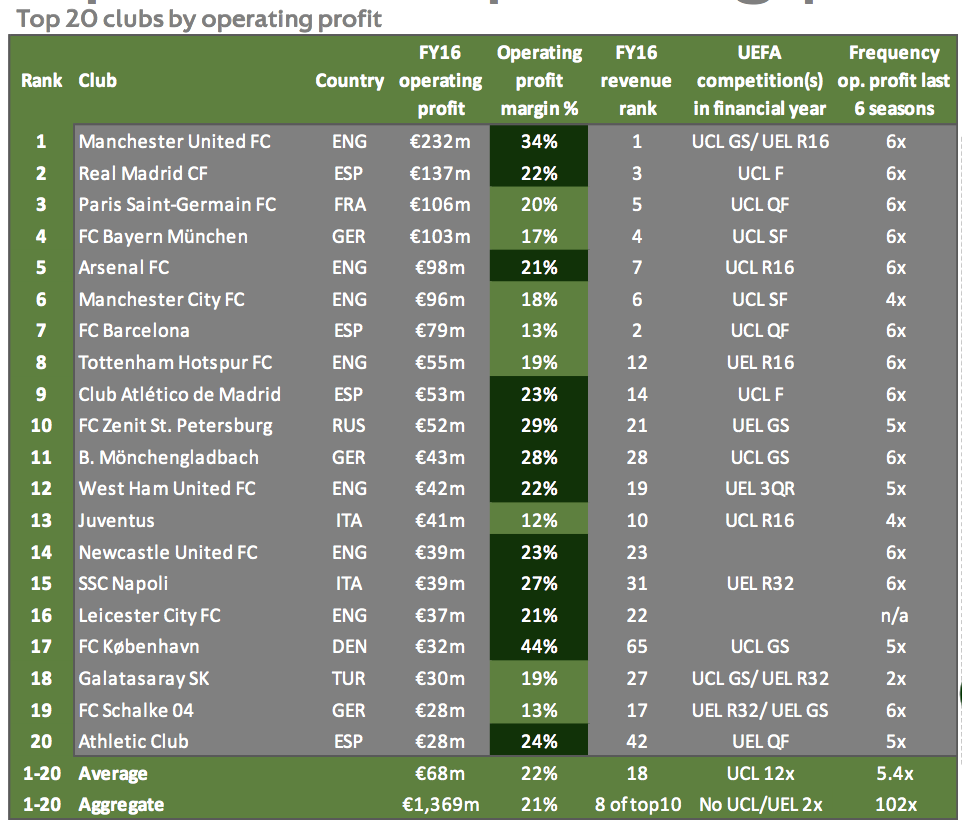
- Club operating costs (excluding wages) increased at a record 8% among the top 20 clubs in 2016, underlining the significant spending away from the pitch that the top clubs are making to support their global club brands
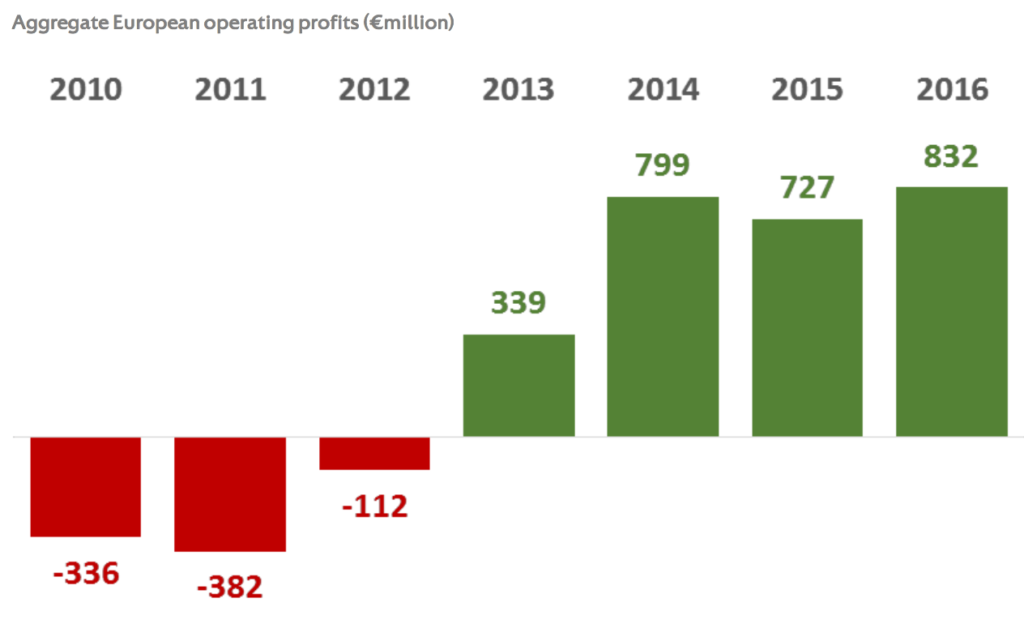
- Record aggregate operating profits of €833m (before transfers) were reported by European club football in 2016
- Combined bottom-line losses (after transfers) have decreased by 84% since the introduction of financial fair play in 2011
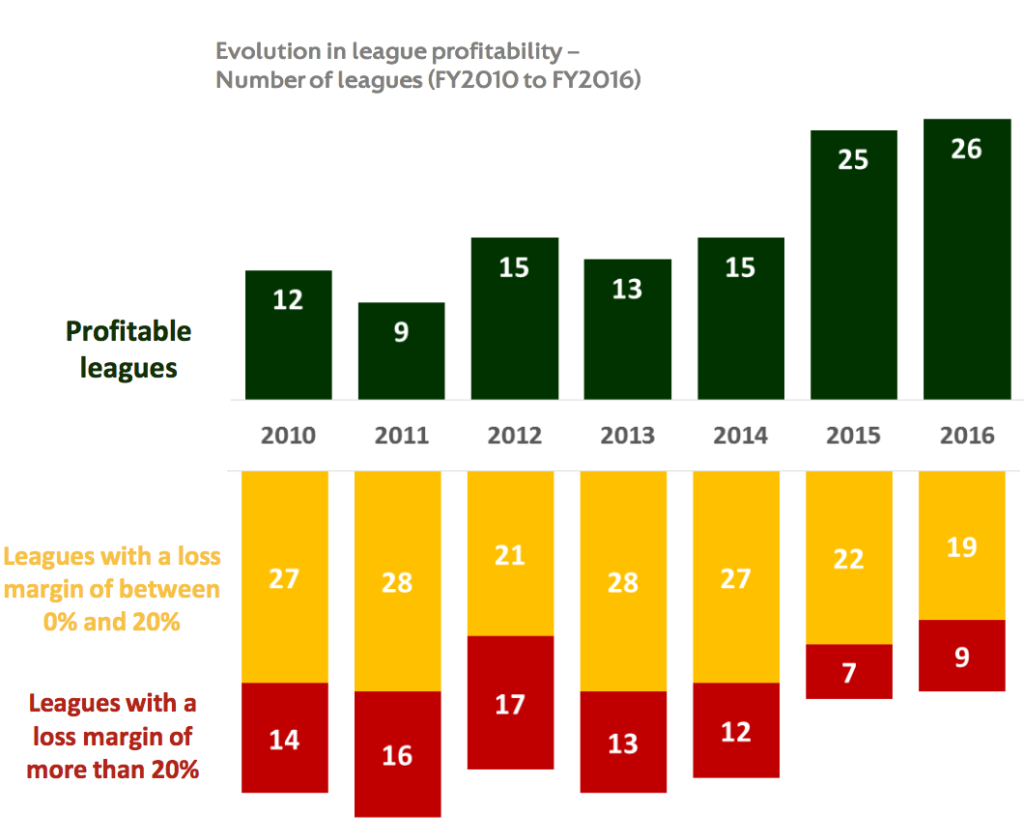
- Just under half the top-division leagues (26 of 54) reported aggregate bottom-line profits in 2016, another record high
Source: All charts, UEFA Club Licensing Benchmarking report, 2016
Contact the writer of this story at moc.l1751372685labto1751372685ofdlr1751372685owedi1751372685sni@n1751372685osloh1751372685cin.l1751372685uap1751372685

