
November 14 – Manchester City have usurped their cross town rivals United on the pitch in the ten years since acquisition by Abu Dhabi United Group in 2008 – a point emphatically proved again last weekend with City’s 3-1 derby win. But off the pitch it is a different story.
A report by the KPMG Football Benchmark group looks at the financial difference between the clubs and finds that United are still in a league of their own, despite City making an admirable shot at financial catch-up.
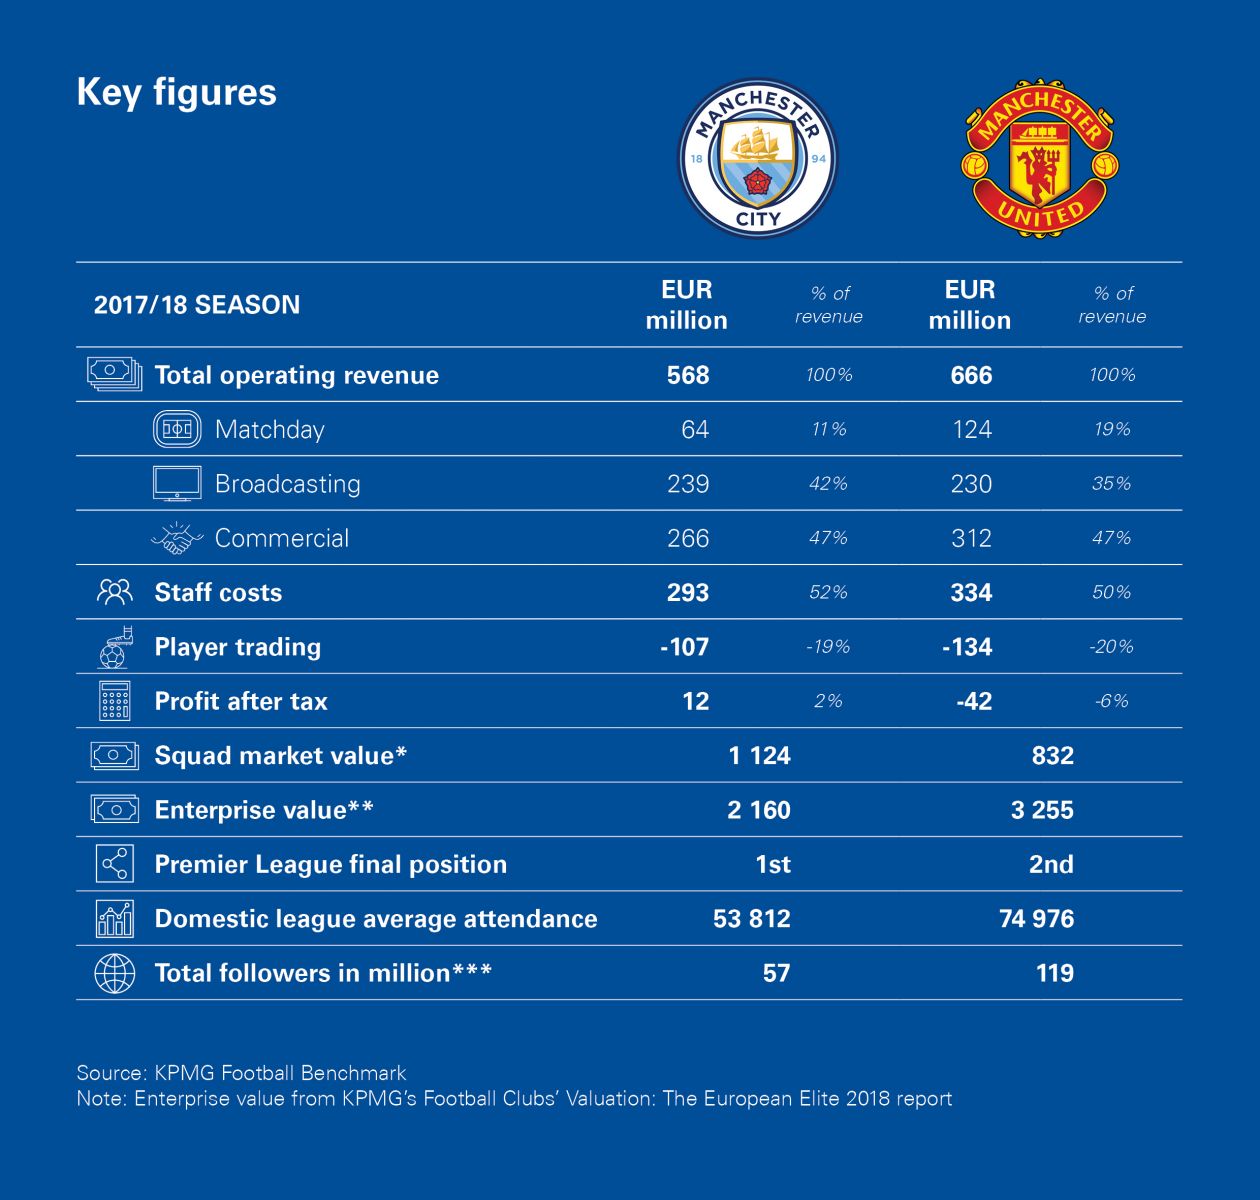
“Considering operating revenues, both clubs show an impressive increase between the 2011/12 and 2017/18 seasons: +76% for Manchester United FC and +108% for Manchester City FC. This higher percentage increase allowed the Cityzens to reduce partially the existing gap with the Red Devils; indeed, while in the first season under analysis United registered revenues 39% higher than City, in the last season such a gap was reduced to 17%,” says the report.
“These figures are a result of the wider international appeal gained by Manchester City FC in recent seasons, which is especially reflected in broadcast (+129% over the seven seasons), thanks to constant UEFA Champions League participation unlike the Red Devils, who have suffered fluctuating on-field performance, and in their commercial income streams (+109%), due to the numerous new partnerships secured both at regional and global levels. Meanwhile, the matchday improvements of City (+52%) are mainly due to the capacity extension of the “Etihad Stadium” in the 2015/16 season.”
But where Man Utd are losing in terms of performance revenues, they significantly ahead in terms of matchday and commercial revenues. Old Trafford sells out its 75,000 capacity every home game compared to City’s 54,000 average attendance last season.
The report authors find that the existing revenue gap with City increased over the years in question, from +9% to +17%. They also point to the recent agreements with adidas and Chevrolet for, respectively, €85 million and €60 million, as “the perfect examples of their best practice. Interestingly, for both clubs such commercial activities represent their main source of revenue, comprising 47% of total operating revenue in 2017/18.”
Looking at costs – a hot area for City in light of the financial revelation of recent week and their battle to stay within FFP rules – the report finds an increasing trend over the past seven seasons with City having jumped 23% and United a massive 75%.
“One remarkable finding is the huge reduction in staff costs/operating revenue ratio in the period under analysis for the Cityzens, whose ratio decreased from 87% in the 2011/12 season to a more sustainable value of 52% in the past season; meanwhile, the Red Devils’ ratio remained stable at around 50%, still below their rivals,” say the authors.
The report examine the financial investment made by both club and finds City’ losses were €206 million in the first three years but dropped to €151 million for the next seven. In contrast, Man Utd made €285 million of net profit in the same period.
The report concludes that “a gap between the two Manchester clubs still exists. However, starting from the first Premier League title won under the new ownership (2011/12), Manchester City FC have been able to keep on growing, reducing the gaps from their city rivals and consolidating their position in the football elite. In the future the challenge is surely on the pitch.”
See the full report at https://www.footballbenchmark.com/manchester_one_city_two_powerhouse_teams
Contact the writer of this story at moc.l1751518683labto1751518683ofdlr1751518683owedi1751518683sni@n1751518683osloh1751518683cin.l1751518683uap1751518683